Abstract
Access to expensive spectrometers is often limited, preventing students from hands-on learning about the field of spectroscopy. Inspired by the Damrauer group’s design1, we modified and optimized a 3D-printed spectrometer design that can be used to collect absorbance and emission data. By testing the effects of (i) changing print thread, (ii) modifying window size, and (iii) testing slit width, we improved data quality and reproducibility.
Introduction
UV-vis spectroscopy is a technique used to measure the absorbance or transmittance of UV and visible light by a sample. This technique can reveal important details about the sample’s composition, purity, and concentration.
The absorption of light results in the excitation of an electron from its ground state to an excited state. The amount of energy that is required is equal to the gap between the two levels, and can be related to the wavelength of light absorbed (Eq. 1):
where is the energy difference between the two states, h is Planck’s constant, v is frequency, c is the speed of light, and λ is wavelength. Thus, the energy of the transition is inversely proportional to wavelength. UV-vis data, such as that presented here, are plotted as a function of wavelength (units of nanometers).
Although there are a finite number of required components, UV-vis spectrometers are often expensive (thousands of dollars) and require dedicated space. Thus, it’s desirable to have a low cost, reliable spectrometer option for outreach labs and field research. Using the design from the Damrauer group (University of Colorado) as a starting a point, we designed and tested new 3D printed components to obtain higher quality data and optimize the data collection process.
Experimental Details
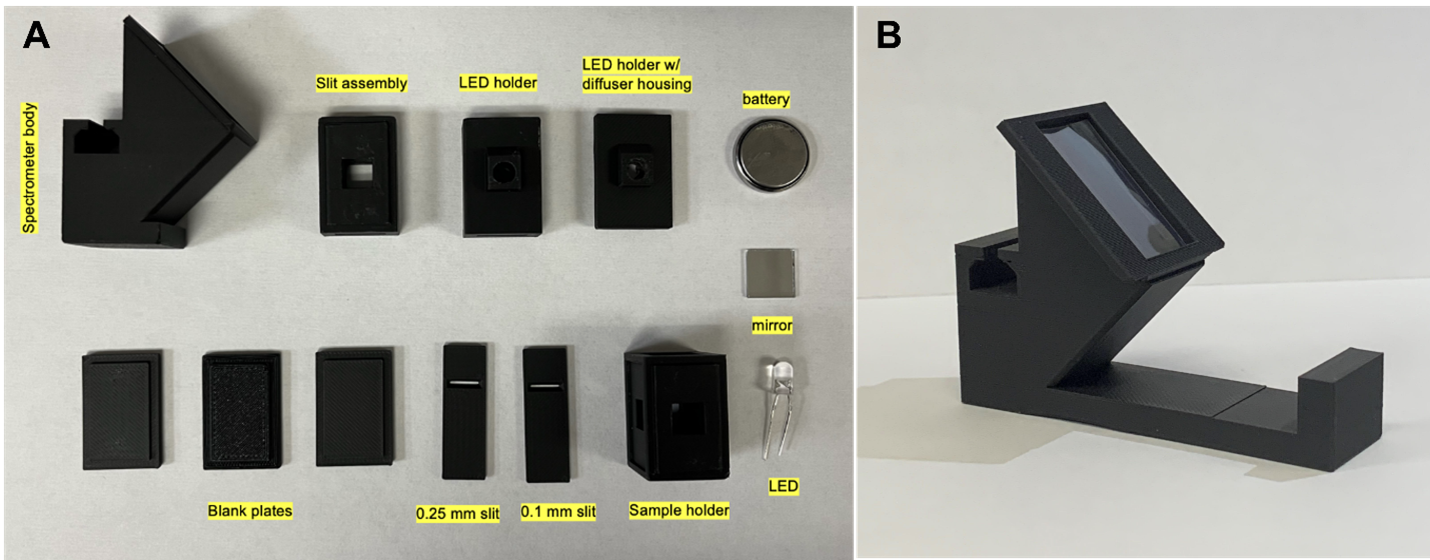
Materials & Design: The original .stl files were provided by Professor Damrauer and were modified using SketchUp. The jobs were printed in the University of Miami, College of Engineering 3D Printing Facility (Fig. 1) using matte black PLA 3D printer filament, and the modular components were assembled using glue dots. Our light source was a 5mm LED bulb powered by a coin battery. Following the recommendation from Prof. Damrauer, we used diffraction grating with 1000 lines/mm. Finally, a small ½ in x ½ in mirror was installed at the base of the spectrometer body. The estimated cost for one spectrometer is $4.39. Additional materials used include a compact fluorescent light (CFL) bulb, 1 cm pathlength cuvettes, DI water, droppers, red (R40) and blue (B1) Gatorade, red (R40 & R3) and blue (B1 & R40) food coloring (1 drop in 30 mL of water), and a cell phone. Initial experiments used several other Gatorade samples, but these were too dilute.

Figure 1. (A) (B)
Procedures: Once assembled, the spectrometer consists of the spectrometer body with cell phone holder, slit assembly, sample holder with two blank plates on its sides, a second slit assembly, and the LED holder with diffuser housing. To reduce noise and stray light, it is best to collect data with lights dimmed or off. The first step is to collect an image using the CFL bulb. For data collection, the cuvette containing the sample is placed in the sample holder. The LED is inserted into its holder, and the appropriate slit insert is placed. The order of samples is (1) blank (water) followed by (2) experimental samples. It is critical that the setup is not disturbed during data collection.
The data collection process is essentially the same as outlined in reference 1 and is briefly summarized here. Once the images are collected, the data are processed using ImageJ online. Photos (.jpg) of the CFL, blank, and samples are uploaded and stacked. Using the rectangle selection tool, the user sets the area of interest that will be analyzed in all images, and then the plot profile is generated. Plot values are copied into Excel for processing. The CFL profile and known wavelengths for each color line are used to convert from pixels to wavelength. The blank spectrum intensity at each wavelength is then used to convert from gray value to absorbance.
Results and Discussion
Most of the changes made to the 3D printed prototype were inspired by problems during data collection. The effects of (i) changing print thread, (ii) modifying window size, and (iii) testing slit width, in our 3D print spectrometer are outlined below.
Print thread - Our hypothesis was that using standard 3D print thread (white, PLA), would result in noisier/less resolved images because of introduction of stray light. To test this, we collected data using the same spectrometer body but with all other components printed in either white PLA or matte black PLA. The data for both material colors had no noticeable differences, meaning this experiment can be performed using any 3D printing material.
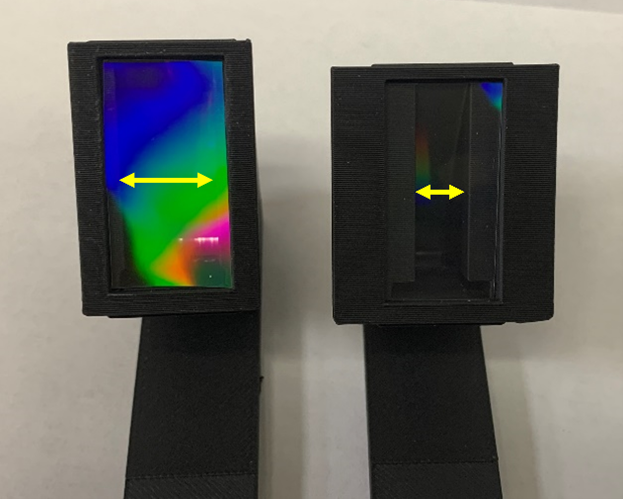
Window size – Originally, we believed that the window size was too small to get a clear view of the spectra (the original design was made in the time of iPhone 5). To accommodate today’s larger phone camera, we expanded the spectrometer window (Fig. 2; yellow double-sided arrows) from 7.5 mm to 12.67 mm. Although we were able to get a clear view of the color spectrum, the data were noisier. We suspect this was because stray light was entering the opening between the phone camera and the face of the prototype. Since the new design has a wider window, less light would disrupt data collection. Ultimately, we decided it was best to stick with the original design. We did, however, add a wider face plate to help stabilize the phone and reduce stray light.

Figure 2. 3D printed spectrometer models with 12.67 mm (left) and 7.5 mm (right) windows.
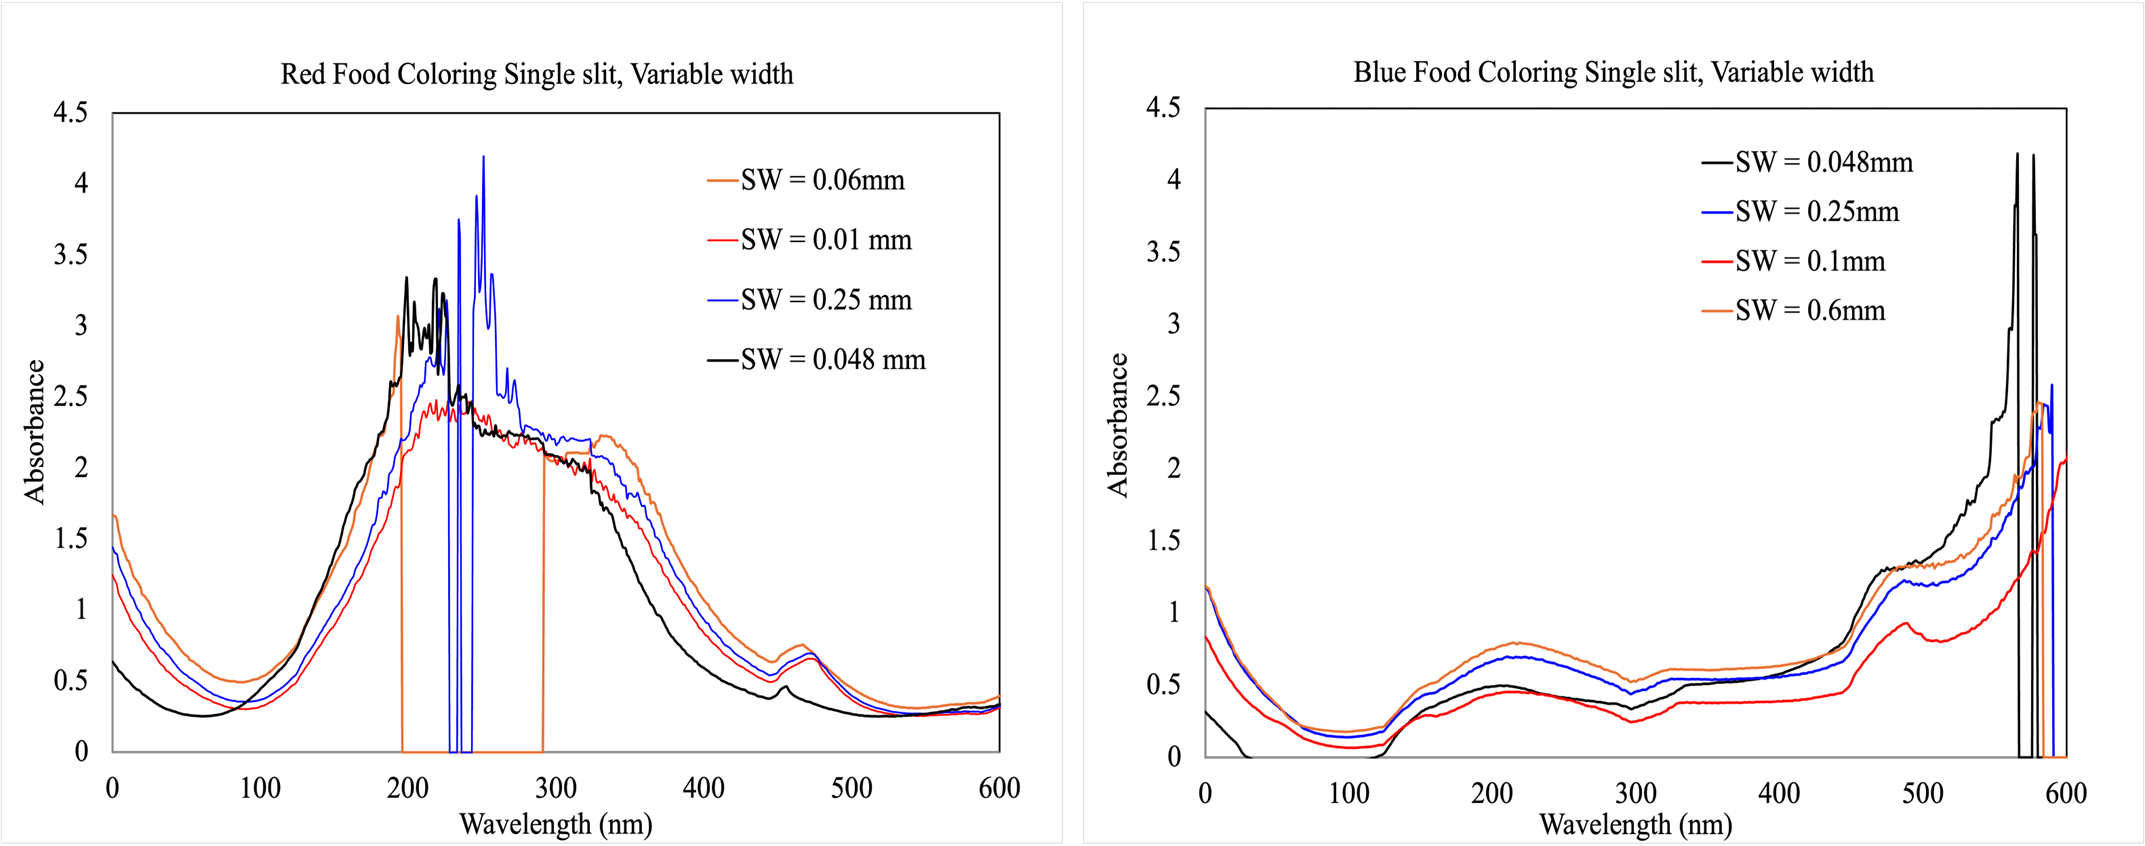
Slit width - Several slit inserts with different widths were printed (0.048 mm, 0.1 mm, 0.25 mm, and 0.6 mm). Our initial hypothesis was that a smaller slit width would focus the light and would improve data quality. After testing, it was concluded that the slit width of 0.1 mm gave the best results.

Figure 3. Red (A) and blue (B) food coloring tested with different slit widths.
The final modification was a phone holder to prevent camera movement and optimize data collection. To enhance reproducibility. Future iterations will improve further on the design so that it can be used for weaker/less concentrated samples.
Conclusion
We successfully produced a cost-effective, 3D-printed UV-vis spectrometer, which underwent experimentation and modifications to optimize the quality of data obtained and to improve the device’s functionality. Making such 3D-printed spectrometers available to high schools will make spectroscopy accessible to a younger population of students.
Acknowledgements
We would like to thank the American Chemical Society’s Project SEED and the University of Miami’s Young Scholar Program for this opportunity to expand our knowledge of chemistry. We are grateful to the Neyton Baltodano Jr. from the College of Engineering 3D Printing Facility for helping us with 3D printing. This project is supported by the National Science Foundation CAREER award under grant No. 2144239. We would also like to thank the graduate students in the Meier Lab for their mentorship and help around the lab. Lastly, we would like to extend our gratitude to Dr. Meier for her guidance in helping us carry out this experiment.
References
- Damrauer, N. H. Modular 3D Printed Absorption and Emission Spectrometer Guide. https://www.colorado.edu/lab/damrauergroup/modular-spectrometer#spectrometer_introduction_and_parts-13 (accessed 2024-06-17).
- LESSON PLAN GENESYS UV-Visible Spectrophotometers Food Dyes and Beer’s Law What Makes Your Drink Blue? https://assets.thermofisher.com/TFS-Assets/MSD/Scientific-Resources/FL53216-food-dyes-beers-law-lesson-plan-uv-vis.pdf (accessed 2024-06-17).
- Raja, P.; Barron, A. UV-Visible Spectroscopy. Chemistry LibreTexts. https://chem.libretexts.org/Bookshelves/Analytical_Chemistry/Physical_Methods_in_Chemistry_and_Nano_Science_(Barron)/04%3A_Chemical_Speciation/4.04%3A_UV-Visible_Spectroscopy (accessed 2024-06-17).


