Abstract
Commercial spectrometers in high school labs offer an engaging way to learn about light properties, spectroscopy basics, and chemical principles. The caveat is that they are often expensive and inaccessible in the school setting. A 3D printed UV-vis spectrometer, however, offers an inexpensive approach to analyzing absorbance in solutions.
Although not as precise in measurement as a commercial spectrometer, this model offers students a hands-on approach to collect and analyze absorption spectra that can be integrated with other chemistry concepts often taught in high school labs.
Introduction
Spectroscopy plays a vital role in understanding how substances in solutions interact with light at the molecular level. Scientists often utilize various instruments and spectroscopic techniques to gain insight into molecular structures, energy transitions, and unknown concentrations of solutions. Commercial spectrometers are the most common instruments used in research labs, but their application in high labs is often limited due to several challenges. First, spectrometers are expensive, ranging from $2000-$10,000 (depending on the model1 and capabilities), an amount that is often prohibitive for most schools. Second, high end instruments often require regular maintenance and can involve expensive repairs which are preferably avoided by limiting access to trained users. These barriers limit future scientists’ access to valuable analytical tools during their early education.
To address this, we developed and improved a low cost, 3D printed UV-vis spectrometer that is derived from previously published models2. Our modified 3D printed spectrometer is easily
accessible for high school labs and field work. Costing around $5 to make, the lightweight instrument works by using a coin battery-operated light bulb, a 1,000 lines/mm diffraction grating (from Amazon), 3D printed cuvette holder, slit inserts, spectrometer body, and phone holder, and a cell phone camera to capture a “spectrum”. The ease of use and accessible cuvette holder that allows easy sample changes contribute to this functional 3D design. Using the image editing software, ImageJ, the images collected for various solutions can be converted into absorption and wavelength data plots, just like those collected with a commercial spectrometer.
During the process of improving the 3D printed spectrometer model, we designed three laboratory experiments, prepared detailed protocols, and established pre- and post-lab questionnaires that can be easily adapted and implemented in high school Chemistry curricula. These protocols focus on different chemistry concepts – acid-base reactions, cosmetic pigments, and plant ecology – and offer students a broad view on how spectroscopy can aid in collecting scientific data
Experimental details
To get students more interested in various aspects of chemistry, emphasis was put on incorporating various branches of chemistry into lab procedures for high school chemistry students. To begin, we identified topics that could be explored through spectroscopy, while still relevant to high school chemistry classes and students. Next, we filtered our list down to three topics and brainstormed labs requiring low-cost, readily accessible materials. Procedures for each of the three experiments were developed, and we went through several trials to ensure the protocols were accurate, clear, and consistent with standard high school Chemistry curricula that we are familiar with. The following highlights the general principles, objectives, and outcomes for the labs that we developed. Exact volumes and more details are provided in the actual protocol sheets. Materials used are listed below and are separated by lab.
Lab 1: pH Reactions and Natural Indicators
- 1 head of red cabbage
- 50 mL ethanol
- 50 mL white vinegar (contains acetic acid)
- 50 mL bleach (Sodium hypochlorite)
- 50 mL baking soda (Sodium bicarbonate)
- pH strips
- Consumables and miscellaneous (pipets, scissors, disposable cuvettes, Eppendorf tubes
- 3D printed UV-visible absorption spectrometer
Lab 2: Plant Pigments and Absorption
- 4 plants of various colors(10g of each)
- 40 mL ethanol
- 3D printed UV-visible absorption spectrometer
Lab 3: Cosmetic Pigments
- Eyeshadow sample (various colors)
- 50 mL water
- 3D printed UV-visible absorption spectrometer
Consumables and miscellaneous items such as pipets, scissors, disposable cuvettes, Eppendorf tubes, etc. were used in all three labs
Results and discussion
A. Lab 1: pH Reactions and Natural Indicators
In this lab, students will use red cabbage to create a natural pH indicator, by extracting anthocyanins from the cabbage using ethanol. Students will use this indicator in several solutions of different pHs, such as vinegar, bleach, and baking soda. Each solution's absorbance spectrum is then measured using the 3D printed UV-vis spectrometer, and the pH of the solution is found using a pH test strip. During this lab, students will also discuss the changes in the anthocyanin structure at different pH values and how this connects to the visible absorption profile that they measure. This lab was modeled off Teach Engineering's4 Red Cabbage Chemistry procedure. To make it more applicable to UV-Vis spectrometry, the concentration of the solutions was altered, and procedure was added for analysis using UV-Vis spectrometry.
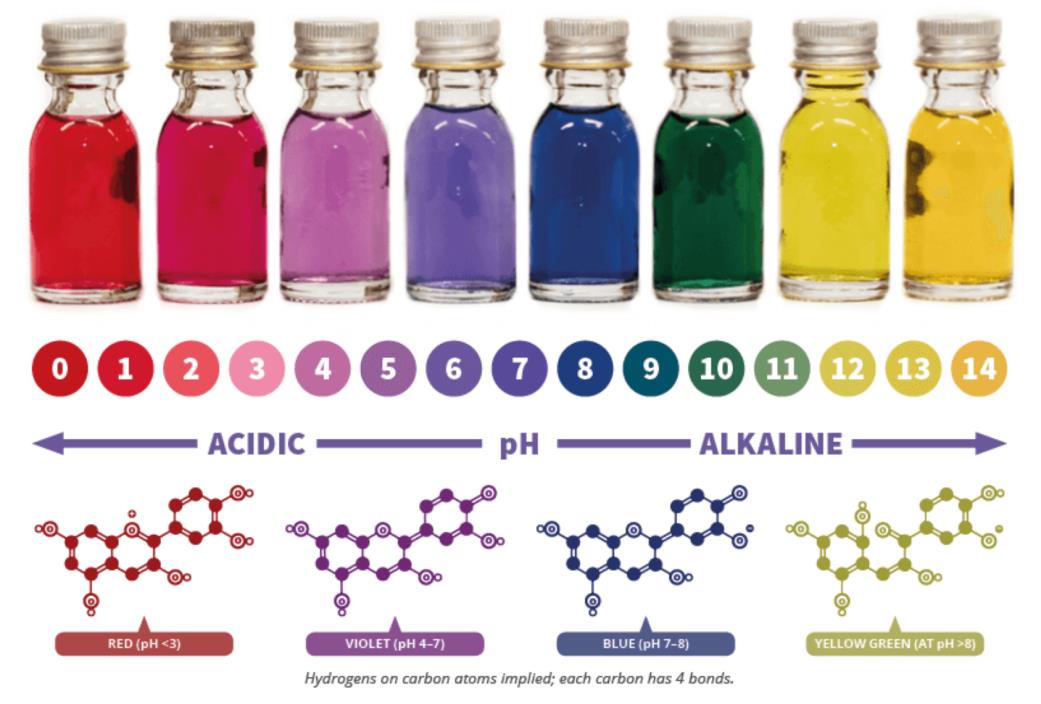
Figure 1. Color spectrum of solutions using a red cabbage indicator3
B. Lab 2: Plant Pigments and Absorption
This lab is best suited for a lesson plan involving ecology and/or chemical basics of plants. Students will collect plants of different colors, such as yellow and green leaves, grass, and flowers. The plants are then soaked in ethanol overnight, and the solution is filtered and collected into test tubes. Each of the samples are then placed in cuvettes and the absorbance spectrum for each is recorded and analyzed (example data shown in Figure 2). The learning objective of this lab is for students to observe differences in the chlorophyll pigments in green plants and to be able to connect these differences to features at distinct wavelengths in the visible absorbance spectra. This lab can also be tied into a lesson plan related to photosynthesis.

Figure 2. Spectra obtained using our 3D (A) and commercial (B) showing identical wavelength peaks around 665 nm
C. Cosmetic Pigments
The third lab that we thought would appeal to high school Chemistry students is related to cosmetic Chemistry. Here, we obtained an eye shadow palette from Amazon, and we selected five distinct eyeshadow colors. Using a scoopula, we shaved off samples of the eye shadows and dissolved the powders in ethanol. There is also an opportunity for an instructor to incorporate additional components related to concentration calculation or measurement, or practical considerations such as using a balance. The dissolved eye shadow powders were vortexed to ensure that the solutions were homogeneous. Although, this is certainly a challenge of this lab, as most of the eye shadow powders were difficult to fully dissolve. The extracted pigment solutions can then be pipetted into cuvettes and the visible absorption spectra can be collected on the 3D printed spectrometer and analyzed using ImageJ (samples and spectrometer are shown in Figure 2. Example data is shown in Figure 3). The light properties of various pigments in the eyeshadows can be compared via the individual absorbance spectra collected by the students.
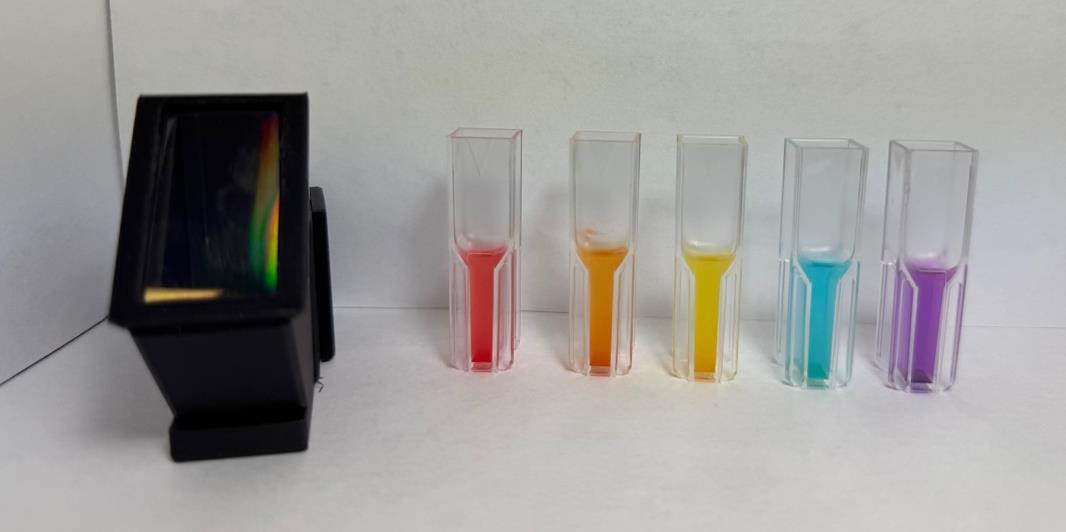
Figure 2. Cosmetic Pigment Solutions Next to 3D Printed Spectrometer

Figure 3. Spectra obtained using our 3D (A) and commercial (B) showing identical wavelength peaks around 540 nm.
To assess the accuracy of the 3D printed spectrometer, we compared the processed data obtained as described above to the spectra recorded using the commercial spectrometer (Shimadzu UV-2600 UV-Vis Spectrophotometer). Although the absorbance spectra are not as precise, the data obtained using the 3D printed instrument is comparable to that of the commercial spectrometer, with the overall trends and maximum absorbance wavelengths being clearly identifiable.
To measure the success of these labs for high school students, we are developing a Qualtrics exit survey for both teachers and students to fill out at the end of the experiment. This survey will assess factors such as clarity in the lab procedures and student engagement, as well as learning outcomes and relevance to lesson plans. Additional space for more specific feedback from instructors will also be provided to improve the integration and success of the 3D printed model and labs in local Chemistry classrooms.
Conclusion
Through this project, we were able to create several engaging labs that will aid in introducing high school students to the topic of spectroscopy. The instrument provides a low-cost accessible route to enable students to analyze absorbance spectra of several solutions. The 3 labs (acid-base reactions, cosmetic pigments, and natural plant pigments) that we developed were based on topics we thought would be of interest to high school students. By comparing data taken from a commercial spectrometer to the data recorded on our 3D printed spectrometer, we were able to determine that the results of the 3D instrument were of sufficient quality for the planned labs, introducing a low-cost and accessible solution to introducing spectroscopy in a high school setting.
Acknowledgements
We would like to express our sincere gratitude to the University of Miami Young Scholars Program and the American Chemical Society Project SEED for helping support this research we were able to conduct at the University of Miami. We are really grateful to these two organizations for connecting us to the Meier Lab and this project. We would also like to thank the graduate students in the lab for their assistance. Last but not least, we thank our mentor in this project, Dr. Meier, for her immense support and assistance during this research experience, as it would not have been possible without her. This project is supported by the National Science Foundation CAREER award under award number 2144239 (to K.M.)
References
1.The Best Spectrophotometers: A buyer’s review of price and features. (n.d.). https://www.labx.com/resources/the-best-spectrophotometers-a-buyers-review-of-price-and-features/4825
2.Damrauer, N. H. Modular 3D Printed Absorption and Emission Spectrometer Guide. https://www.colorado.edu/lab/damrauergroup/modular-spectrometer#spectrometer_introduction_and_parts-13 (accessed 06/06/2025).
3.Making a red cabbage pH indicator: the method and the chemistry. (2023, February 17). Compound Interest. https://www.compoundchem.com/2017/05/18/red-cabbage/
4.Red Cabbage Chemistry. (2023, October 26). [Video]. TeachEngineering.org. https://www.teachengineering.org/activities/view/wst_environmental_lesson02_activity3
5.LESSON PLAN GENESYS UV-Visible Spectrophotometers Food Dyes and Beer’s Law What Makes Your Drink Blue?https://assets.thermofisher.com/TFS-Assets/MSD/Scientific-Resources/FL53216-food-dyes-beers-law-lesson-plan-uv-vis.pdf (accessed 06/16/2025).
6.Raja, P.; Barron, A. UV-Visible Spectroscopy. Chemistry LibreTexts. https://chem.libretexts.org/Bookshelves/Analytical_Chemistry/Physical_Methods_in_Chemistry_and_Nano_Science_(Barron)/04%3A_Chemical_Speciation/4.04%3A_UV-Visible_Spectroscopy (accessed 06/16/2025).
7.Bruininks, B.; B.F. Juurlink, L. An Inexpensive 3D Printed Periscope-Type Smartphone-Based Spectrophotometer for Emission, Absorption, and Fluorescence Spectrometry. ACS Publications. https://pubs.acs.org/doi/10.1021/acs.jchemed.2c00060

